January 5, 2024
As we come to the end of 2023, 16½ months have passed since the passage of the Inflation Reduction Act (IRA) on August 16, 2022. We are beginning to see the impact of the IRA, the Bipartisan Infrastructure Law (BIL) and the CHIPS+ act on the ground, including in north central Appalachia – coal country. As we do, “ReImagined Appalachia” begins to transition from an idea, a possibility, into a reality.
This blog summarizes the findings of two of the first “systematic” data sources on the geography of sustainable manufacturing investment since the passage of the IRA. A companion blog by Diana Polson highlights some early examples of job-creating investments – in battery production, solar manufacturing, and solar energy.
The first systematic data source: the MIT Center for Energy and Environmental Policy Research and the Rhodium Group have created a database that tracks 90% of the investment (total investment not just public) in the first year after the passage of the IRA (i.e. Q3-2022 to Q2-2023) in clean technology manufacturing, utility-scale clean energy deployment, and industrial decarbonization investments. (Data on retail purchases by businesses and households, such as electric vehicles or rooftop solar systems, is only available at the state level.)
The MIT and Rhodium researchers find that the share of clean investment occurring in fossil-fuel communities (“energy communities”) is nearly double the share of the national population living in these communities (36.8% versus 18.6%). As the figure below shows, this reflects high shares of investment in utility scale solar, wind, and energy storage and a share of national manufacturing investment slightly below energy communities share of the U.S. population.

While the MIT and Rhodium publication does not allow us to separately analyze the share of investment going to the four RA states, a second source does. The U.S. Solar Photovoltaic Manufacturing Map includes active manufacturing sites that contribute (or will contribute) to the solar photovoltaic supply chain. The Solar Energy Technologies Office (SETO) of the U.S. Department of Energy gathered the data for this map from public sources and through direct communication with producers. Looking at the map for the entire United States makes clear that the Midwest including Pennsylvania and southern states below the Midwest and Pennsylvania have the lion’s share of U.S. solar manufacturing.

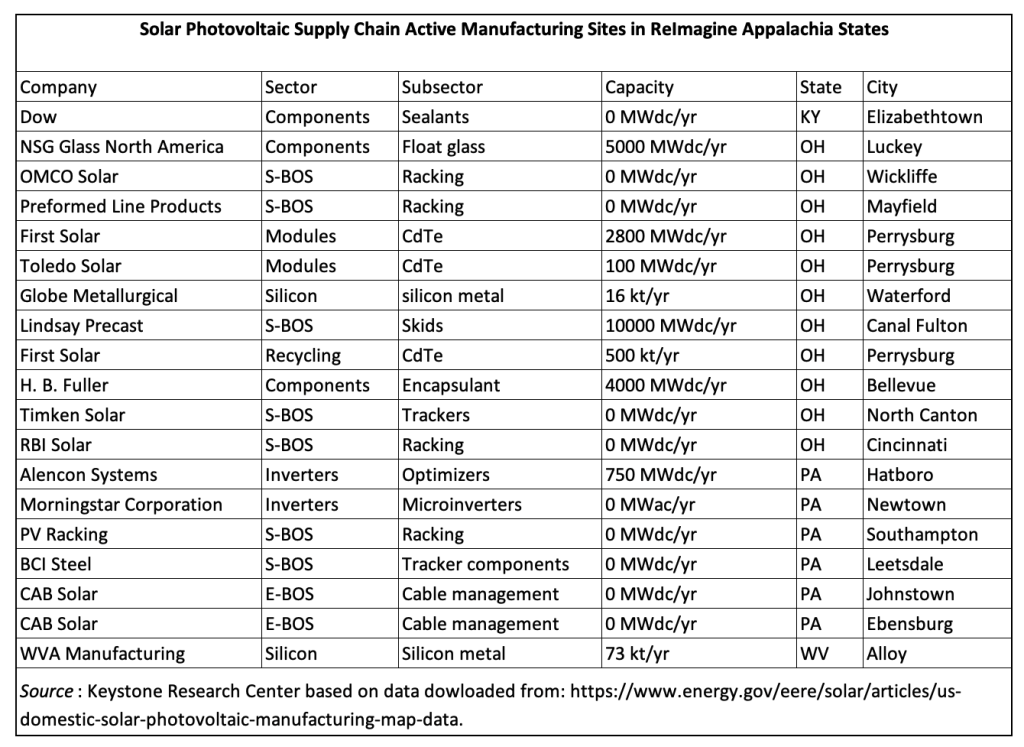
Below the map you can click on “Download All Projects Data.” This takes you to another link where you can download a data set in Excel that identifies the state, city, latitude and longitude of each facility, along with its production capacity (zero in some cases because facilities are under construction). Using these data, we found that the four RA states have 19 of 125 plants, 15% of the total, which is roughly 1.5 times our four states’ population-based share. Ohio has 11 plants, Pennsylvania six, and Kentucky and West Virginia one each.

Growing sustainable manufacturing and the clean energy supply chain in the ReImagine Appalachia footprint – leveraging unprecedented federal funding and unlocking much larger amounts of private investment in climate action, infrastructure, and innovation – are exciting first steps. Critical additional steps, of course, must make sure that communities benefit from federally subsidized projects including through the creation of good new union jobs for diverse workers and dislocated former coal workers. Working to ensure that the ReImagine Appalachia region take those additional steps will be a critical part of our work in 2024 and beyond.
